I exited my position in $SJ.TO quite recently. It was a successful investment for me, as it is a position I leaned into significantly in terms of position size, saw good gains from during a timeframe that was fairly tough for broader markets.
Anyways, I haven’t posted in a while, so figured I’d dig up my old write up from June 2022 on the company, seeing as at this point I had only shared a tweet thread summarizing the thesis, as well as a short post in the past.
The notes below are a bit jumbled - I had a bit more concise, cleaner version of this that I had submitted to VIC at the time, but it doesn’t have any charts or screenshots, which I thought were useful to include. Looking back, I do like the Why Opportunity Exists portion as taking a look back an constructing a narrative supported by numbers on what has driven long, medium, and short-term performance of a stock is a very useful exercise.
Thanks for reading, and hope to post something new before the year is out.
As always, this should not be considered investment advice. Please do your own research and verification.
Thesis Summary: SJ is a durable business with stable profitability; around 70% of revenues are related to infrastructure maintenance, which are attractive during periods of economic uncertainty/weakness. Over a multi-year period, the company is likely to grow slightly faster than GDP, and management plans to pay out 25-30% of present market cap ($2B CAD) in dividends and buybacks over the next 3 years. The stock currently trades in the low end of an 8+ year range and at a 2.6% dividend yield, which is in line with levels only seen in March 2020 and the GFC. I believe the company can steadily grow its dividend per share in the neighborhood of 15%/year over the long term (5-10 years) through a combination of revenue growth, buybacks and increased payout ratio.
Durable, good quality business: SJ is the major supplier of Railway Ties and Utility Poles within North America, and also produces treated lumber for outdoor residential projects. They have significant exposure to infrastructure-related revenues, which tend to be fairly stable; a lot of utility pole and railway tie sales are for replacement purposes, though the replacement cycle is quite long (multiple decades for utility poles). Their treated lumber segment gives them exposure to the home construction/renovation market.
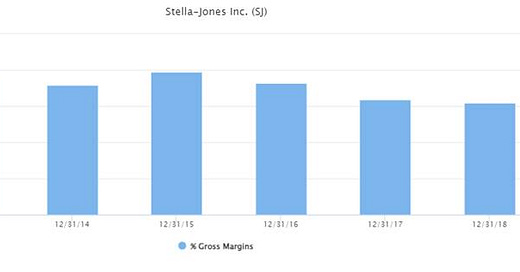
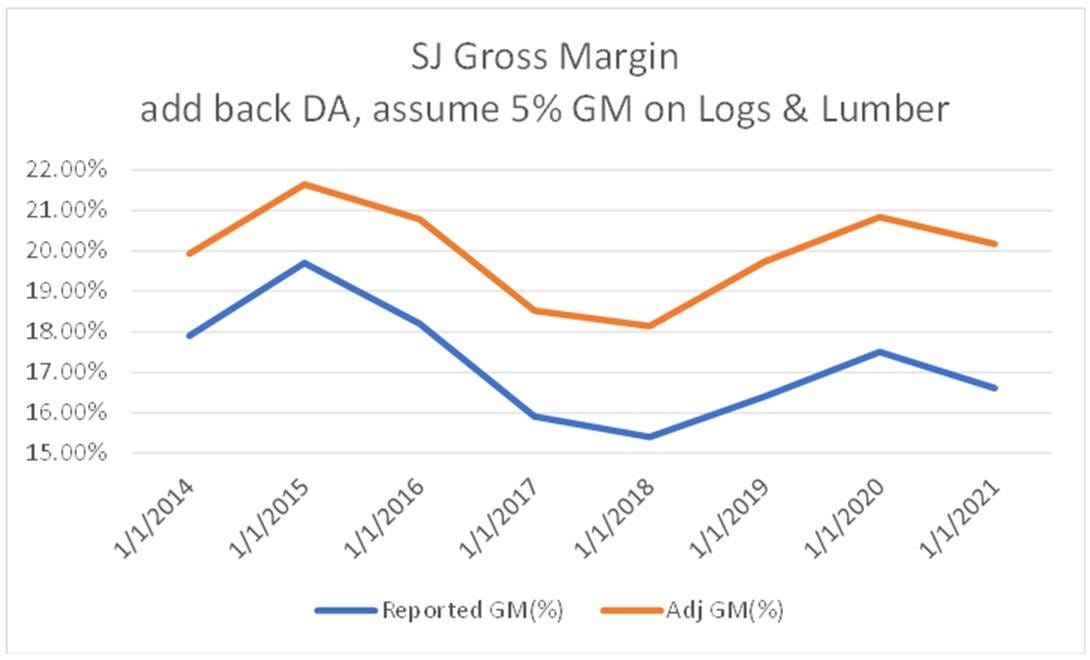
While SJ operates within the commodity (lumber) space, they are a value-add producer and aren't overly exposed to the volatility in lumber prices; despite some major price swings in lumber over the past decade, SJ has exhibited quite stable gross margins.
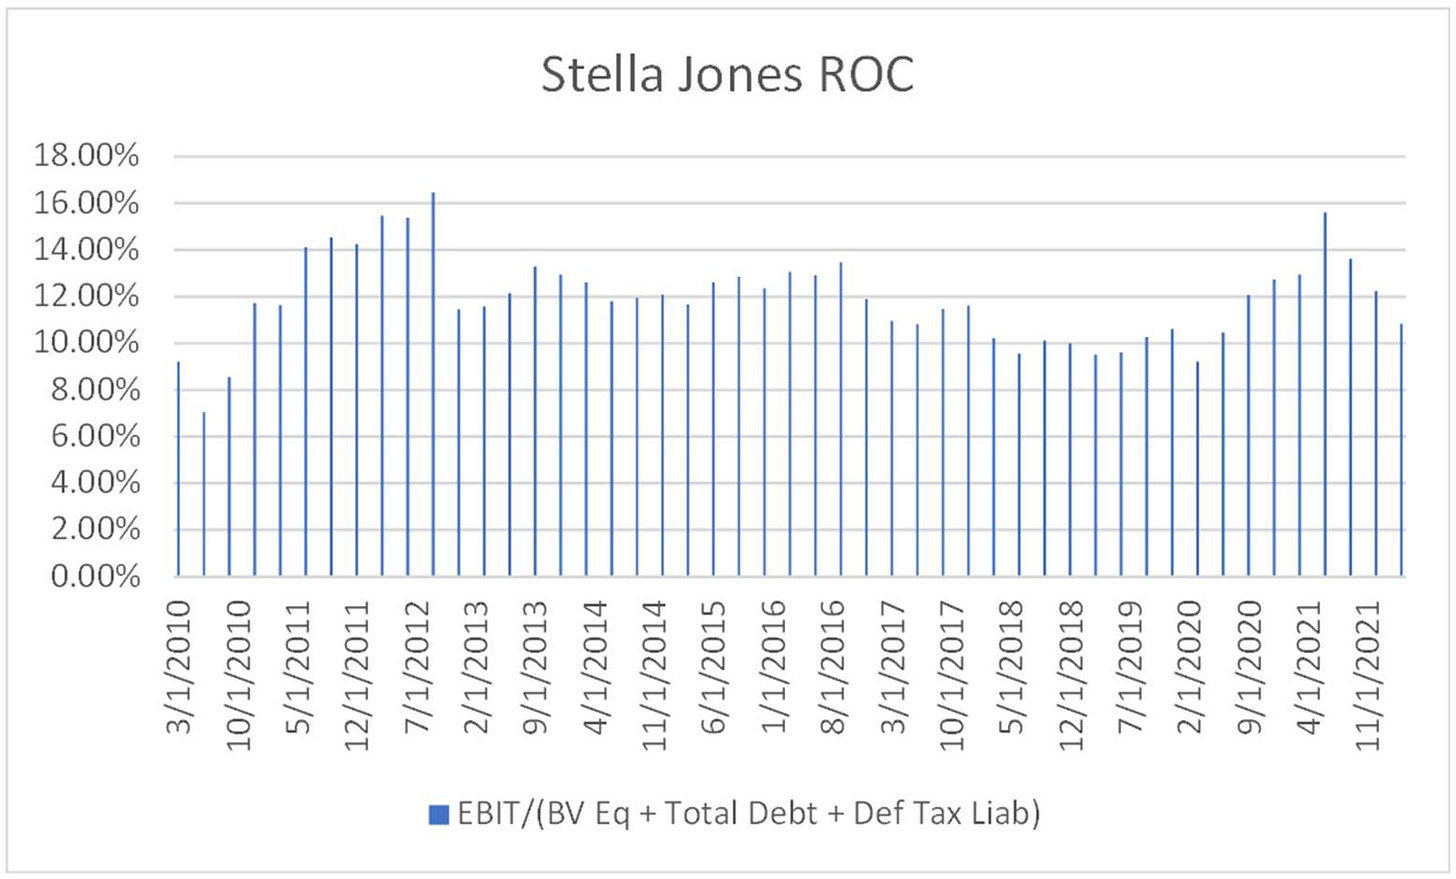
SJ has maintained quite consistent, double-digit Return on Capital (defined as EBIT/ Total Equity + Total Debt + Def Tax Liability), which supports the assertion of SJ's business being of respectable quality.
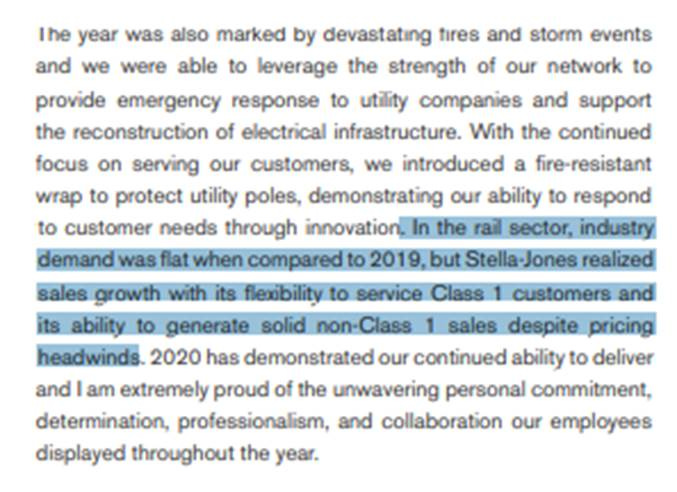
SJ's scale puts them in a favorable position in the industry; in 2020 railway tie volumes were down industry wide, yet SJ was able to take share and increase volumes. SJ grew rail tie revenues every year from 2017 except 2021 (where volume was up, but pricing down) despite a decline in annual tie purchases from the mid 2010's.
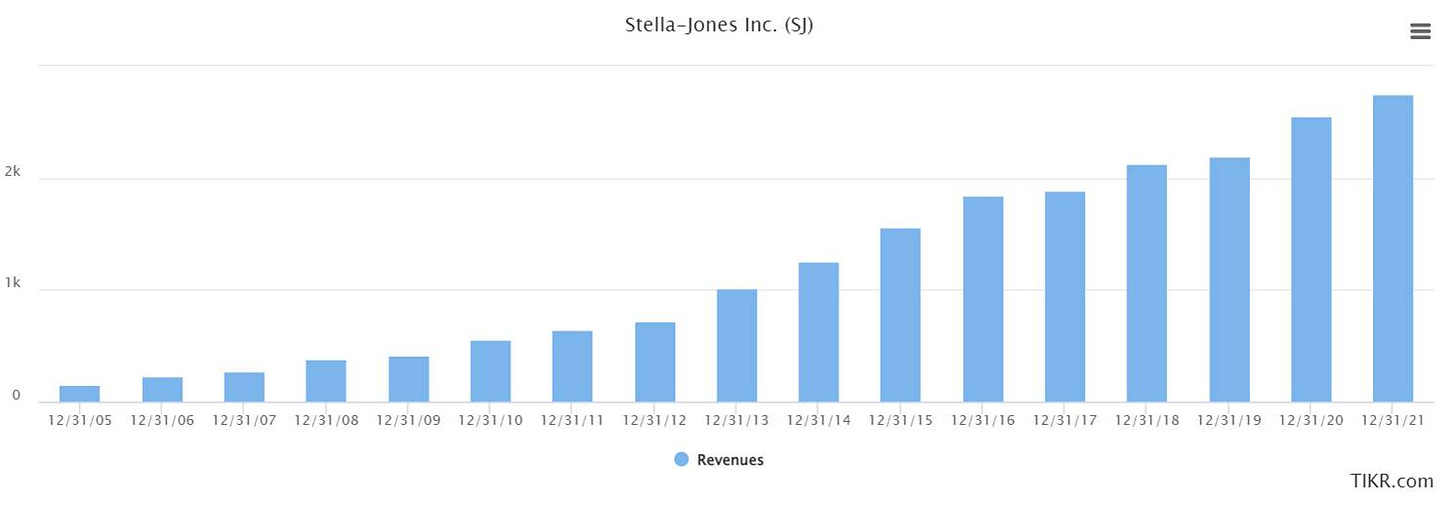
In addition to stable profitability, SJ has managed to consistently grow revenues consistently, and 2021 marked the company's 18th consecutive year of dividend increases.
For a company with quite resilient cash flows, leverage is moderate, with under 1B in total Debt, which is about 2.5x 2021's Operating Cash Flow+ Tax Payments + Interest Payments of 365M; interest expense has been around 25M each of the past 3 years. Overall, SJ's debt load and stable profits puts it at low risk for rising interest rates to negatively impact the company's financial position due to rolling over debt at higher borrowing costs or needing to significantly pay down debt.
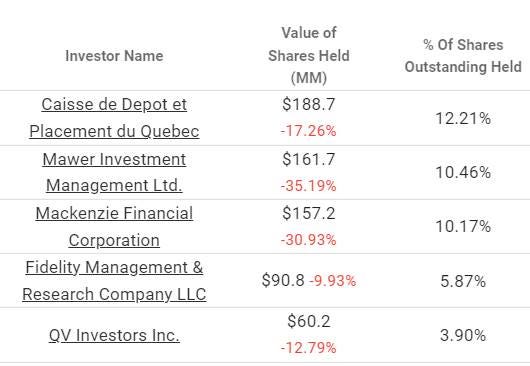
Finally, Mawer owns more than 10% of the company's shares, which I think supports the assertion of SJ's business quality. Mawer is one of the best institutional Canadian Equity managers and has a quality oriented investment approach.
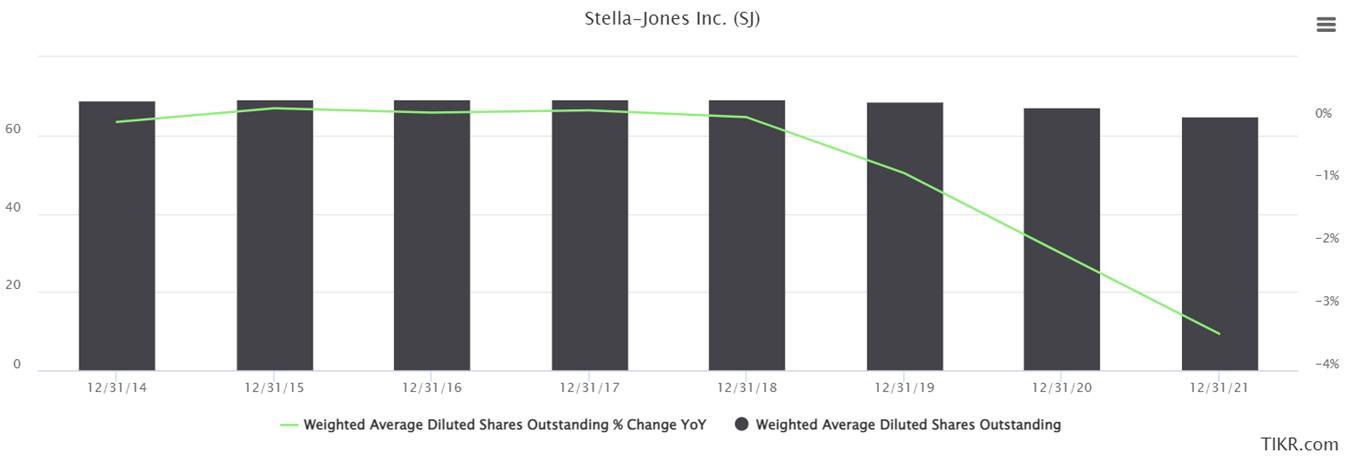
Sensible, Shareholder-friendly Capital Allocation: SJ pays a dividend and has tended to increase their per-share dividend at a double digit rate annually. They make small acquisitions on a fairly regular basis, and more recently (since late 2019) have been buying back a considerable amount of stock and reducing the company's outstanding share count.
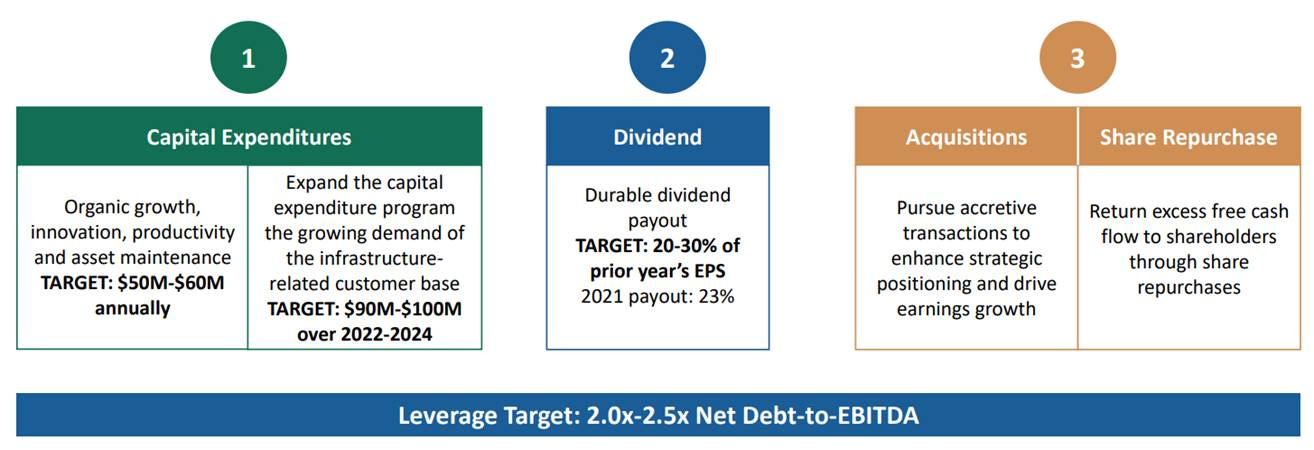
The company recently announced its capital allocation plan for the next 3 years, which includes additional capex above run-rate 50-60M to support growth from infrastructure customers, and paying out 500-600M in dividends and buybacks.
Why Opportunity Exists: For much of the 2000's and first half of 2010's, under McManus, Stella Jones went on a run regularly making acquisitions, consolidating the industries it operates in. SJ supposedly would court family-run businesses over a multi-year period before making acquisitions
The acquisition track record was good - 2009 was the only year of non-double digit revenue growth, and revenues grew from 2005-2016 at a 25% CAGR while maintaining gross margins steadily around 20%. Importantly, the cost of this growth was quite attractive: shares outstanding only grew at 4.5% (with no money spent on buybacks), and the firm's Net Debt/EBITDA fluctuated between 2-3x over the period. As a result, the stock went from $1-3/share in the mid 2000's to the mid-40's come the mid 2010's. Much of the returns can be attributed to the 20% CAGR in Sales per share.
By the early 2010's SJ had the traits of a "compounder" stock. The company was growing rapidly, as acquisitions at the time - while comparable in size to recent acquisitions - were large in relation to the size of the company, and quite frequent. The stock had a premium valuation and reached all-time highs in December 2015 while trading at a trailing P/E of 28x.
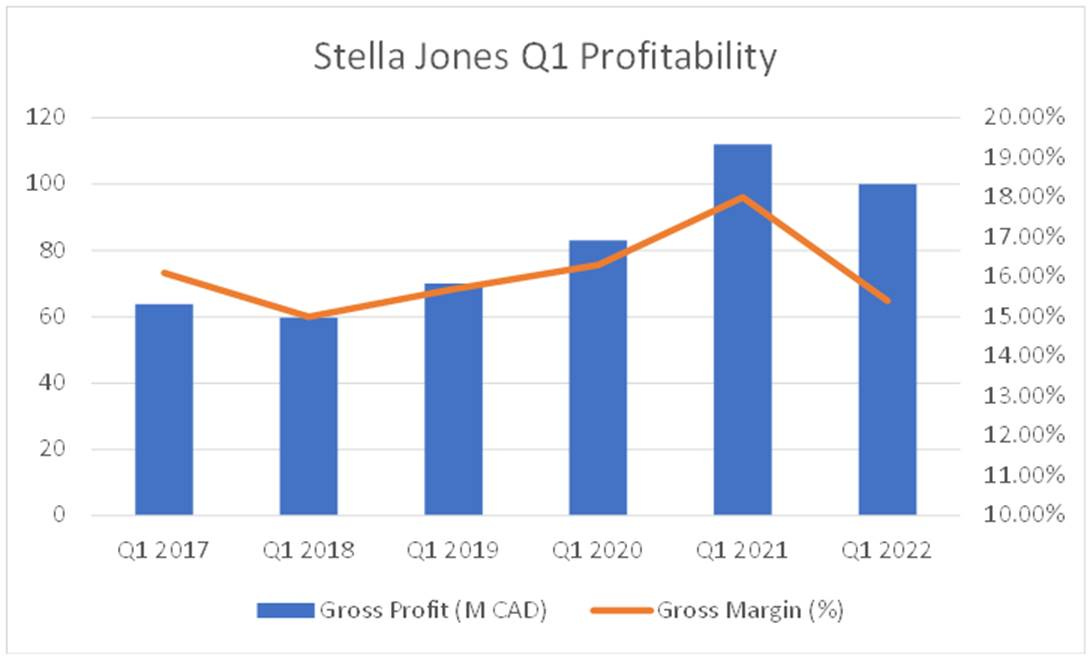
However, the pace of acquisitions slowed, and the size of acquisitions were no longer as large in comparison to the overall size of the company, and revenue growth slowed. In addition, following the commodity bust in late 2014, industrial activity in North America slowed, and the company experienced some compression in gross margins (see earlier Gross Margin Chart; reported Gross Margins declined from high teens to around 16%). Much of the margin weakness in this period was attributable to flatlining demand for railroad ties and excess inventory needed to be worked off at lower prices, which negatively impacted margins in that business segment.
While the company continued to grow and be profitable in the latter half of the 2010's, it failed to live up to the elevated expectations embedded within the stock price at the mid-point of the decade, and as a result, SJ has largely traded in a range of $34-52 for 8+ years as the shareholder base has transitioned from growth to value-oriented investors. The stock has appeared in more value-oriented portfolios over the past few years, with QV Investors re-initiating a position in 2019, and John Cole who runs a value investing blog recently purchased the stock and wrote about it here: Portfolio Update: Bought Stella-Jones – Mispriced Markets
More recently, results within SJ's residential lumber segment seem to be driving the stock - this segment has driven much of the business's growth over the past 5 years with segment revenues doubling from 2017 to 2021. SJ matched its all-time high of $53.15 on April 19, 2021, which coincided with the peak in lumber prices, and on May 3, 2021, the company announced its Q1 2021 earnings and raised guidance for the year.
However, since then lumber prices have been volatile, falling from over $1,500 to $600. During Q2 2021 earnings, SJ revised their 2021 guidance back downwards, and again in Q3, only to come back down to what management was originally forecasting for 2021 in Q4 2020 (which the company ended up hitting). In particular, weakness in residential lumber and railway ties negatively impacted gross margins in both Q3 and Q4 of 2021 (as management foreshadowed during Q2's call). This string of reduced guidance and challenged quarters saw the stock consistently underperform both the TSX and S&P 500, falling 33% in the one year between Q1 2021 and Q1 2022 earnings releases.
Q1 2022 earnings weren't so bad, with gross Margins improving back towards levels consistent with Q1 of 2017-2020. Though lumber prices have again collapsed in the period following the earnings release, from $1,000 to $600.
Path to Returns
Revenue Growth: I think the company can grow revenues at 5% or better over the next 5-10 years. Management is guiding to mid-single digit revenue growth over the next 3 years, but guidance doesn't include the impact of M&A or any benefits from the recently passed American infrastructure bill (though they are increasing CAPEX to support increasing demand from infrastructure clients). I think the company is setting themselves up to be able to beat guidance; the company did 8.4% in revenue growth from 2017-2021 without any notable acquisitions impacting results over that period.
There are several industry tailwinds which could support each of SJ's business segments in the coming years and contribute to 2020 being a more favorable environment for SJ's business than 2015-2019. Large scale spending to upgrade internet and power infrastructure should be good for the company's pole business, and any "onshoring" of supply chains to North America and uptick in mining activity with higher commodity prices should bode well for railroad activity, which tends to be good for tie replacements. In addition, railway tie inventories have been worked down quite a bit since the pandemic, with rail volumes and tie purchases stagnant, which could set the stage for a cyclical tailwind for margins within that segment. The company's residential lumber segment is exposed to housing activity, and though it may experience near-term weakness, it should do well if North America sees an uptick in housing construction in comparison to the 2010's. Finally, climate change has seemingly increased the occurrence of extreme weather events which have caused significant damage to infrastructure, such as recent floods in BC, North Dakota blizzard, and storms in Ontario and Quebec, which could further add to demand for replacement ties and poles.
Hydro poles: Where do they come from? | CTV News
B.C. flooding: Trains rolling again after landslides cut key supply links | CTV News
Capital Allocation: As the business matures, I expect CAPEX and M&A to become a lower share of Operating Cash Flow, allowing the company to increase Dividends as a percentage of Operating Cash Flow from around 20% towards 30% in the medium term(within 5Y), and perhaps towards 40% longer term; management states they target DPS at 20-30% of last year's EPS, and has been at the low end of this range. The size of M&A has remained quite consistent over time, and maintenance CAPEX has been relatively stable, and not increasing at the rate which revenues have (though there is additional investment capex for the next couple years).
Management's current capital allocation plan is to return 500-600M to shareholders in the form of dividends and buybacks over the next 3 years. 2021 Dividends were 47M, so assuming some growth in dividends, a run rate of $50M/year seems like a reasonable estimate, which leaves 350-450M available for buybacks. I think that may be a little bit optimistic, but SJ does have the balance sheet strength to consider using it to support the buyback program. At current prices, that amount of buybacks could reduce share count by more than 15% in just 3 years. Again, I think this is a bit optimistic, but over a period of time greater than 5 years, I think a reduction in share count of 15-20% is achievable.
Summary: A combination of reduced share count, increasing revenues and payout ratio can work together to allow SJ to grow its DPS at a rate in the neighborhood of 15%/year over the next 5-10 years. With a current dividend yield of 2.6%, in line with March 2020 and GFC levels, and a P/E around 10x, the combination of income, growth and possible valuation expansion (obviously influenced by prevailing interest rates) creates the possibility of attractive long term returns from a fairly low beta stock.
Some Risks:
Old CEO (McManus) left late 2019. Possible that M&A isn't as successful going forward.
Poles (or ties) lose share to non-wood products
Significant weakness (perhaps including inventory write downs) in residential lumber leading to a prolonged decline in segment sales and margins.
Residential Lumber consolidation is an avenue of growth. May face competition here (though SJ has better Balance Sheet than competitors). RL is more cyclical than infrastructure segments and likely drags down overall multiple of stock as it grows as a percent of revenues.
Even if I'm correct on stable margins, modest (5%) revenue growth and capital allocation, SJ is a mature business and the terminal value of SJ will be impacted on the prevailing interest rates several years out. If the UST 10 year is above 3.5%, then a similar maturity corporate is likely yielding 5%+ which makes it unlikely SJ sees much P/E expansion (and perhaps even some compression)
Misc. Quality Notes: The industries which SJ operates in are quite mature, low-growth, low margin, capital intensive
Most railway tie revenues come from maintenance; not many new railroads are being built. In addition, the railway tie industry is quite consolidated, with SJ having around 50% market share, and Koppers being the next largest player.
Utility Pole revenues are similarly skewed towards maintenance, though have more organic growth than railway ties. The industry has been consolidating, with SJ and Koppers being the top 2 players, though apparently there is a bit more potential for consolidation within the industry.
The Residential Lumber segment would appear to be the more cyclical business segment, and least consolidated.
Due to transportation costs, the business is naturally geographically constrained and doesn't scale globally.
Poles and Ties are commonly treated with creosote, which is a known carcinogen and requires a license to produce. SJ has one creosote plant, and that hasn't changed for many years. Governments likely aren't handing out licenses to build new creosote plants.
SJ's railroad and telecom customers are quite large after those industries have experienced consolidation. A potential competing supplier to SJ would need considerable scale and reliability to offer a compelling value proposition to most of SJ's customers and take share. This seems unlikely given that the industries which SJ operates in are fairly capital intensive; they require fairly large employee bases, a decent amount of PPE and ongoing CAPEX, require maintaining relationships with a fragmented network of lumber mills, and are fairly low-margin businesses; SJ reports gross margins in the upper-teens, but doesn't break out margins by segment.These don't strike me as the characteristics of an industry which entices new business formation and increases competition - particularly the ties and poles business.
If you think about SJ's railway & tie customers, these are businesses with natural monopolies or oligopolies, and to avoid too much regulatory scrutiny, they need to be focused on maintaining reliable networks. Because of that, network maintenance is quite important to these businesses and they need to be able to rely upon their suppliers being able to service their needs. In order for SJ to keep its customers happy while preserving profitability, it needs to manage its inventory successfully.
Why SJ and not Koppers or Doman Building Materials?
Prefer the Infrastructure segments. Doman doesn't have that, and is focused on residential lumber and other building materials.
In addition, Doman has a dividend yield near 9%, which likely means the market is thinking it's going to get cut/diluted. I'm don’t know off hand what Doman paid for the company, but it was a large acquisition and near the top of lumber prices and around when this cohort of stocks started selling off. They have a material debt load, and if you see this segment's sales come off and margins compress a bit, suddenly there won’t be enough cash to cover the dividend.
Koppers also has less favorable interest expense than SJ, and they're in the process of deleveraging towards a target, which leaves less cash flow available to distribute to equity holders in the near term. While they recently reinstated a dividend, it's quite miniscule.
Like-for-like gross margin comparison shows SJ has the best margins. SJ also has better revenue per employee than Koppers
Long-term stock chart suggests SJ is doing something better that Koppers.


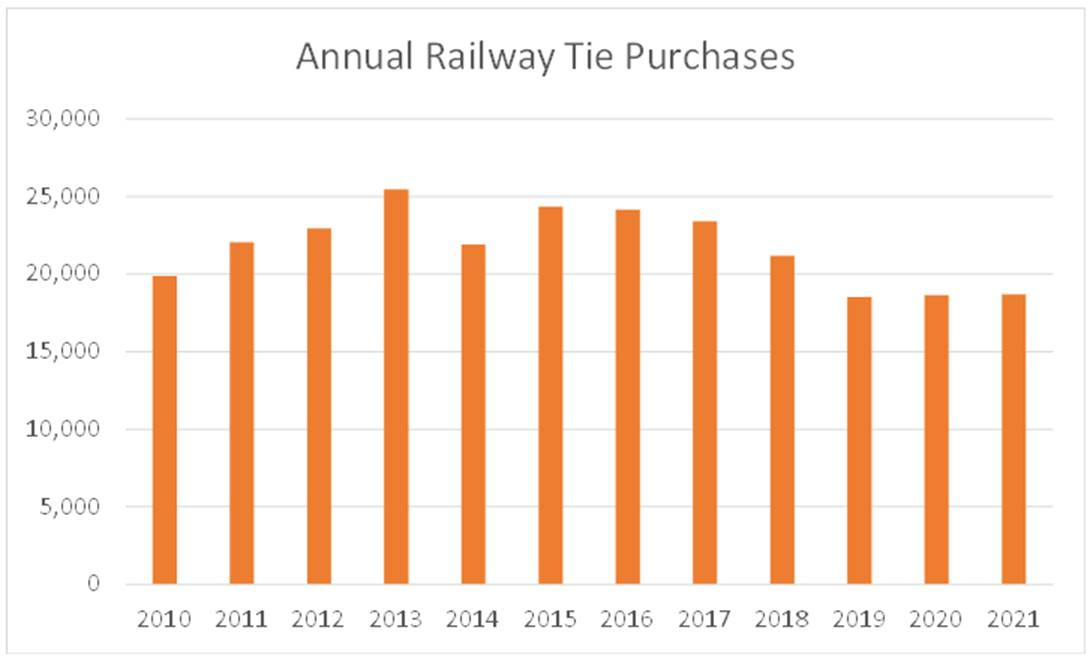


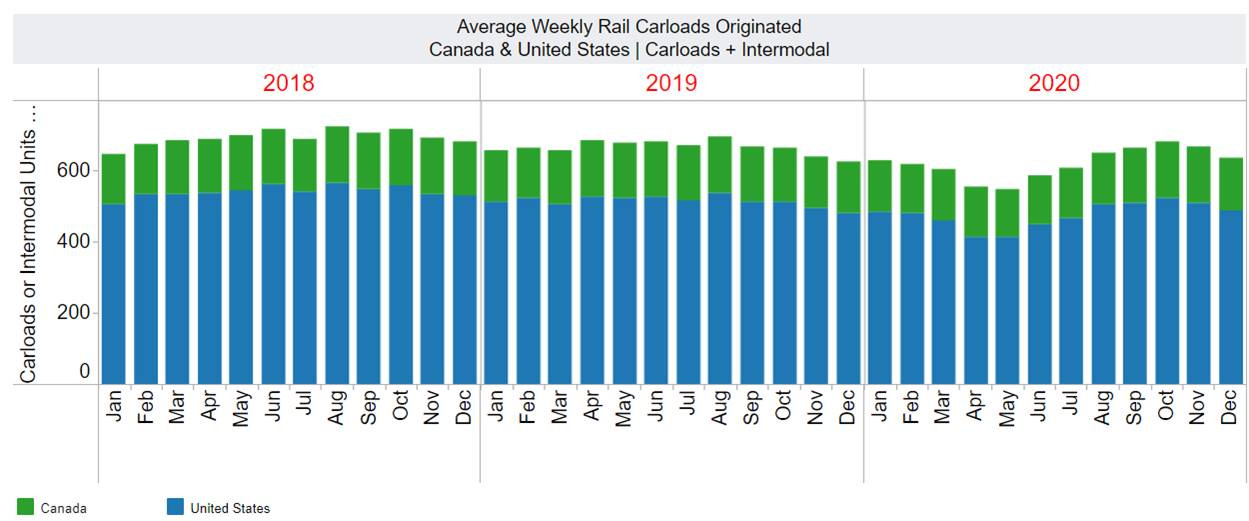
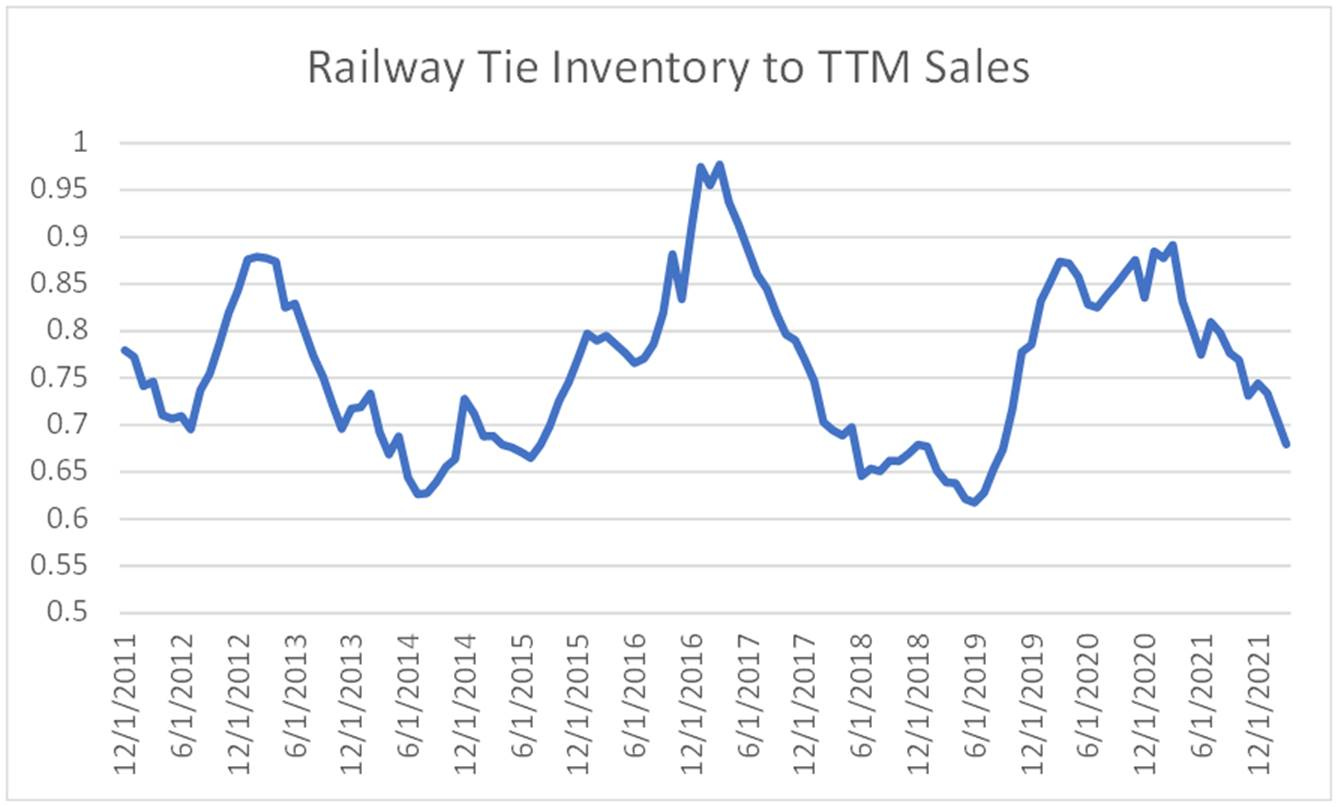



Thanks. It was a while ago I had put that together. I believe it was from: https://www.rta.org/monthly-trends
Hi Gaelan, nice write-up. Where did you get the numbers for the "Annual Railway Tie Purchases"? Thanks in advance!